Geo-Measurement &
$1B+ Pipeline Supported
Two years as the sole analytics & experimentation function for SVB'sStartup Banking division — building measurement infrastructure, designing 130+ experiments, and supporting decisions across a $1B+ pipeline.
What the Control
Changed About the Decision
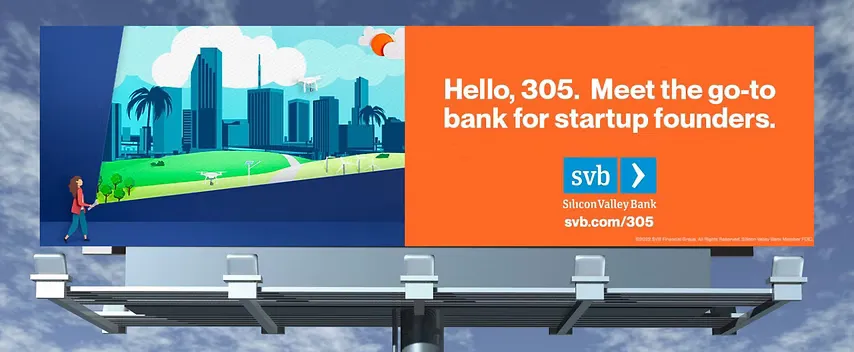
Leadership treated out-of-home advertising as a brand channel — something unmeasurable. I designed a comparative geo testacross Austin, Miami, and Seattle to find out whether the market-level evidence supported a broader investment.
I built an offline-to-online attribution pipeline for the campaignusing QR-enabled billboard tracking tied to CRM. All three markets grew, but the digital-only Seattle control grew fastest, so the result did not establish causal OOH lift. It did make direct responses traceable and gave leadership a more honest basis for the expansion decision.
The Experiment
Design
OOH drives measurable web traffic and CRM-attributable leads
The hypothesis wasn't just "billboards work" — it was that out-of-home media creates a measurable lift in web traffic, lead generation, and CRM pipeline when compared to a digital-only control market.
Matched-market geo comparison
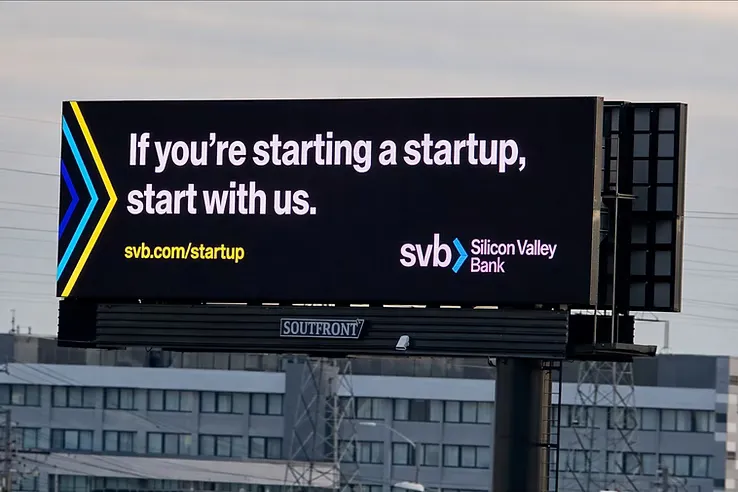
Austin and Miami received the full media mix: airport displays, highway billboards, taxi wraps, bus stop posters, plus LinkedIn and Twitter. Seattle ran digital only. Markets were matched on startup density, VC activity, and SVB market share.
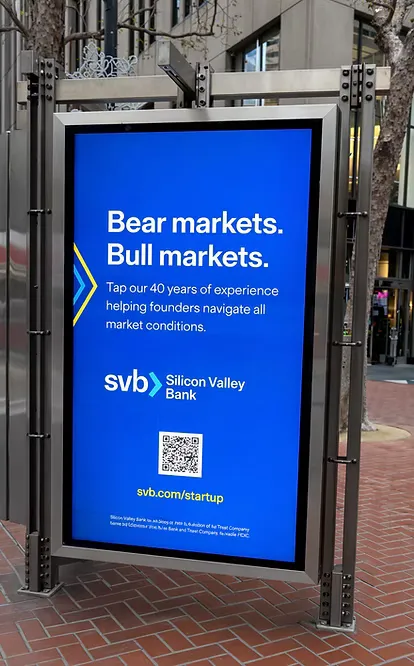
QR-enabled billboard tracking tied to CRM
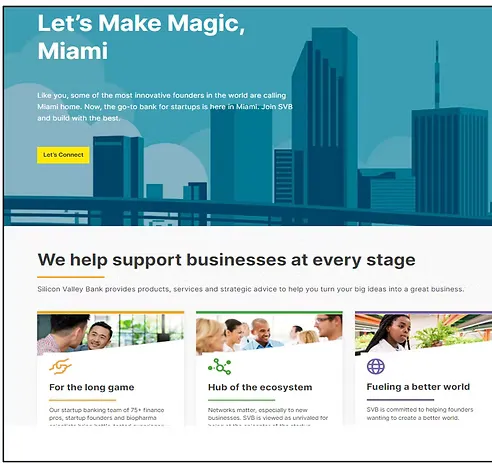
Tracked placements used unique QR codes or market-specific URLs routing to dedicated landing pages. Those direct-response paths connected visits and downstream lead events to the CRM, creating a campaign-level offline-to-online attribution pipeline.
The control prevented an easy overclaim
Web traffic increased in every market, but Seattle's 114.3% increase exceeded Miami's 97.8% and Austin's 94.4%. That pattern did not prove incremental OOH lift. Leadership still used the complete campaign readout in follow-on planning, while the attribution system provided a stronger foundation for future tests.
One Campaign,
Three Cities
SVB was a household name in San Francisco, New York, and Boston — but nearly unknown to founders in the emerging hubs of Miami, Austin, and Seattle. Marketing answered with creative built on a local hook (Austin got "keep innovation weird") and city-specific landing pages fronted by local bankers. I designed the test that measured it: out-of-home ran in the test markets while Seattle stayed digital-only as the control. Tracked direct-response paths connected market-specific URLs or QR codes to web and CRM events; the separate geo comparison measured aggregate market movement.

Supporting a $1B+ Pipeline
With Full-Funnel Analytics
Sole analytics function for SVB's entire Startup Banking division — owned both marketing analytics and product analytics end-to-end during the role.
Built the measurement infrastructure that tracked startup acquisition from first touch to funded account. Owned conversion funnel analytics, digital channel performance, and product usage data for a division serving thousands of VC-backed startups. Expanded into 4 new markets: Austin, Miami, Boston, Seattle.
What I Built
at SVB
Full-Funnel Attribution
First-touch to funded-account tracking across all digital channels. Connected marketing spend to actual banking relationships opened.
Looker Dashboard System
Replaced 6 manual reports with 1 unified Looker dashboard. 85% reporting efficiency gain. Self-serve analytics for the marketing team.
NPS & CLV Systems
Built Net Promoter Score and Customer Lifetime Value measurement from scratch. Connected satisfaction data to retention and expansion revenue.
Geo-Experimentation Framework
Offline-to-online attribution pipeline. Presented and taught geo-experimentation methodology to 50+ marketers. Replicable framework for future campaigns.
The Analytics Behind
the Rebrand
The Startup Banking segment — pre-Series A life science and technology founders — was under real pressure: neobanks like Mercury and Brex on one side, theJPMorgan-scale incumbents on the other. Marketing led a full rebrand and nurture program to stand out and sync with sales. The rebrand needed proof it worked.That was my half.
I built the analytics layer that made every initiative accountable — positioning, content, the nurture flows, and the banker-led outreach. If an initiative didn't move a tracked number, we changed it. The rebrand stopped being a matter of taste and became a matter of evidence.
Industry- and stage-specific nurture, A/B-tested to the email
Founders who weren't sales-ready entered a nurture flow segmented by industry and fundraising stage. I ran it as an experiment — five emails, up to ten variants each — teaching founders how to evaluate a startup bank while warming the brand, so they arrived ready instead of cold. I owned the measurement framework, the guardrails, and the read on which flows actually converted.
Banker-amplified, hyper-personalized existing-customer marketing
For existing accounts, the program amplified each account's assigned banker and served customized up-sell and cross-sell offers. Across the broader operating period, internal dashboards recorded +23% cross-sell conversion, +7% NPS, and +5% customer lifetime value. The available readout does not isolate those changes to this single personalization treatment.
Experimentation on partner properties (Techstars, YC)
Beyond our own site, I ran experiments on the partner properties where founders first met the brand — testing where our lead capture sat, how our placement compared to competitors', and how to route the highest-intent founders straight into the sales pipeline.
Proof, Not Just
Impressions
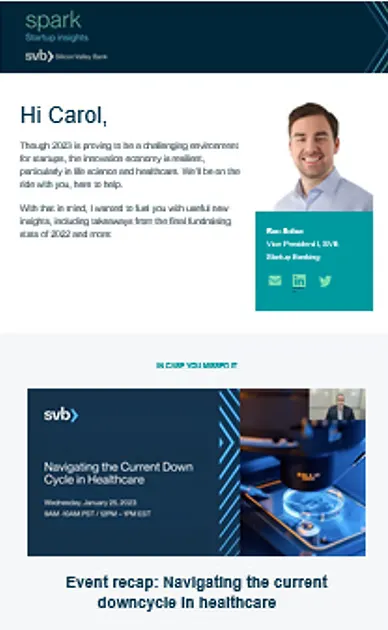
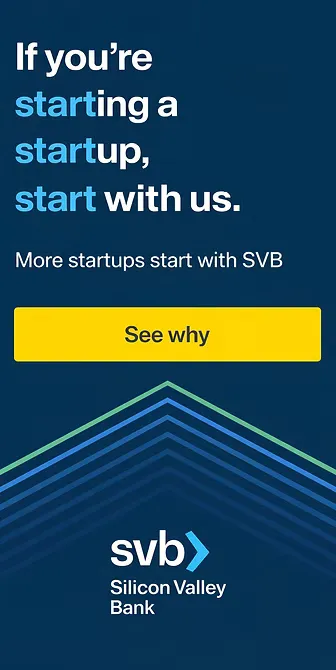
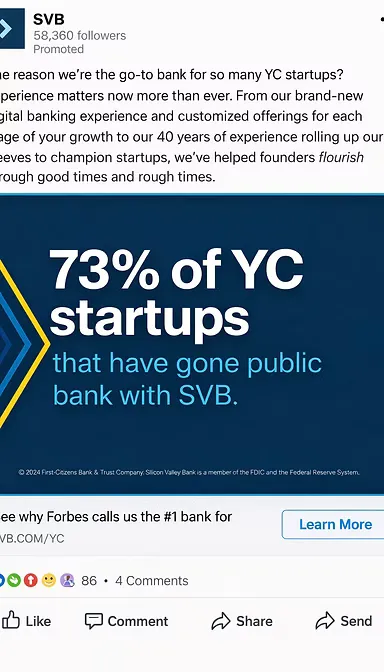
The broader startup campaign used two distinct evidence paths. Market-specific URLs and QR codes made some direct responses traceable to web and CRM events. A separate geo comparison evaluated aggregate market movement. Neither path made every exposure observable.
“While I have worked with many marketing analysts over my career, Atticus Li stands out as one of the very best.”
See all case studies
See how these same principles scaled at NRG Energy across 5 regulated retail brands, dig into individual test-level evidence in the Experiments hub, or read weekly breakdowns on Lean Experiments.
Make Growth Decisions
You Can Defend
Know what to test, when to trust the result, and what to do next. Practical decision guides for analysts, growth teams, and founders.
Opens Substack to confirm · Free · Unsubscribe anytime
Read Better Decisions
Practical guides on experimentation, analytics, commercial judgment, and using AI without outsourcing the decision.
Open Substack (opens in new tab)